Estimated IQ distribution of children given IQ of parents
Let’s try to estimate the distribution of the “genetic IQ” of some offspring assuming that we know the parental “genetic IQ.” Following Hsu (2014), On the genetic architecture of intelligence and other quantitative traits, let us start with the following assumptions:
- A number of independent, additive alleles determine your IQ
- The ‘major’ (+, higher probability) version of each allele increases your IQ, whereas the ‘minor’ (-, lower probability) version lowers your IQ
- Each (+) or (-) effect is equal in magnitude
- The frequency of the minor allele is approximately

- Each standard deviation of IQ difference corresponds to differences in about 40 SNPs
- Therefore, we can calculate that approximately 10,000 alleles control IQ
These are inexact but plausible, “good enough” assumptions; see the paper for a more detailed discussion.
Note that this ignores environmental contribution, does not account for regression to the mean, and so on; it is purely an attempt to work through the math, in a “bottom-up” approach, deriving the distribution of genetic outcomes expected in the offspring given what we know about the additive genetic architecture of intelligence.
A person with exactly average IQ would have 8.5k (+) alleles and 1.5k (-) alleles. Similarly, a person with 1 SD higher IQ would have 40 more (+) alleles and 40 fewer (-) alleles.
Suppose that two parents have IQs of  and
and  standard deviations away from the mean. Then:
- Parent 1 has
 (+) alleles and
  (-) alleles
 - Parent 2 has
 (+) alleles and
  (-) alleles
Our goal is to calculate the distribution of (-) alleles which a child will inherit from these parents.
Theoretical calculation
Assume that the genotypes of parents 1 and 2 are completely independent, and that at each allele, the child has a 50/50 chance of inheriting each parent’s copy of that allele.
At the alleles where both parents 1 and 2 are (-), the child will definitely inherit a (-) allele. The number of such positions follows a distribution
![\[X \sim \mathrm{Hypergeometric}(10000, 1500 - 40x, 1500 - 40y).\]](/wp-content/ql-cache/quicklatex.com-c02be62a909ed36cecb9b71a2240597b_l3.png "Rendered by QuickLaTeX.com")
For intuition, in the case where  (parents have average IQ), this distribution has mean
  and variance
  . In general, of course, we have
![\[\mu_X = \frac{(1500 - 40x)(1500 - 40y)}{10000}\]](/wp-content/ql-cache/quicklatex.com-44a4acacfe5598f744654904dff731e2_l3.png "Rendered by QuickLaTeX.com")
and
![\[\sigma^2_X = \frac{(1500 - 40x)(1500 - 40y)}{10000} \frac{(8500 + 40x)(8500 + 40y)}{10000 (10000 - 1)}.\]](/wp-content/ql-cache/quicklatex.com-312b3b1ced28800b6fe57d15e6d92f91_l3.png "Rendered by QuickLaTeX.com")
Assuming that  (-) alleles overlap, the rest of course do not overlap. That means that:
- Parent 1 has
 (-) alleles paired with Parent 2’s (+) alleles
 - Parent 2 has
 (-) alleles paired with Parent 1’s (+) alleles
At each position, we basically have a fair coin flip for the (+) or (-) allele, and here the number of (-) alleles should follow a distribution
![\[Y \mid X \sim \mathrm{Binomial}(3000 - 40x - 40y - 2X, 0.5).\]](/wp-content/ql-cache/quicklatex.com-ccbe112331bbe5d0f1fe58a8fa6d7fdc_l3.png "Rendered by QuickLaTeX.com")
Calculating the mean is easy, because we are just taking the expectation in an additive way, and so

For the variance, let us simplify the algebra by defining  and
and  , so that
  . Then from the law of total variance,
![\begin{align*}\mathrm{Var}[Y] &= \mathrm{Var}[\mathrm{E}[Y \mid Y']] + \mathrm{E}[\mathrm{Var}[Y \mid Y']] \\&= \mathrm{Var}[pY'] + \mathrm{E}[p^2Y'] \\&= p^2 (\mathrm{Var}[Y'] + \mathrm{E}[Y']) \\&= p^2 (\sigma^2_X + 3000 - 40x - 40y - 2\mu_X) \\&= \frac{1}{4} \left( \sigma^2_X + 3000 - 40x - 40y - 2\mu_X \right).\end{align*}](/wp-content/ql-cache/quicklatex.com-c2f99f7e611d50a3f3a3e2f099268ae5_l3.png "Rendered by QuickLaTeX.com")
Now, the total number of (-) alleles the child inherits follows a distribution  , with a mean

and a variance

Intuitively, we see that the resulting IQ of the child is distributed with a mean that is exactly equal to the average of the parents’ IQs. This is not too surprising. The more interesting component is the variance; because 40 (-) alleles correspond to one phenotypic standard deviation in the population distribution (i.e., a difference of 15 IQ points), a variance of  (-) alleles corresponds to a standard deviation of
  IQ points.
Empirical results
Suppose that  , so that the parents have identical IQs. Then for all reasonable choices of
  , the child’s IQ will vary with a standard deviation of about 10.5 to 11.5 IQ points:
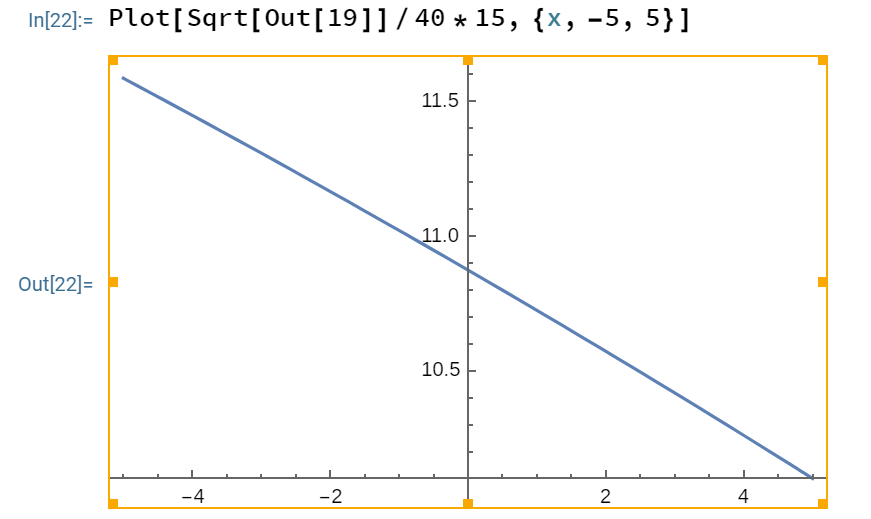
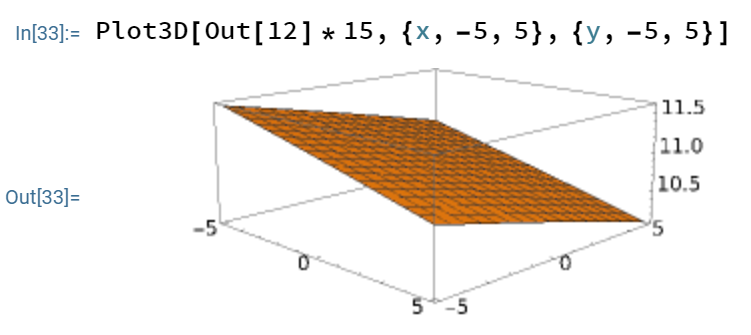
It in fact looks that for any reasonable choices of (not necessarily identical), the child’s IQ will vary with a standard deviation of about 10.5 to 11.5 IQ points:
This is actually a pretty large range of variation: nearly as high as the population standard deviation! Furthermore, there is an environmental component to intelligence; the genetic heritability in adulthood is estimated by Vinkhuysen et al. (2012), Reconsidering the Heritability of Intelligence in Adulthood: Taking Assortative Mating and Cultural Transmission into Account as 0.82, raising our estimates of the standard deviation of the child’s IQ to ~12 IQ points.
There are various effects here that may affect the quality of our estimate. For example, parents should have very positive genetic correlation (e.g. similar ethnic group), leading the variance quoted here to be a modest over-estimate. Parents’ intelligence levels may themselves be subject to measurement error, and the parental IQ itself has an environmental component, effects which lead us to under-estimate the child variance. Ultimately, while the specific number may be not be precise, the argument here nevertheless seems to suggest that IQs of children are sampled from quite a wide distribution, with a standard deviation potentially well exceeding >50% of the population distribution’s standard deviation.
Real-world significance
What is the significance of this result? It means that IQ variation within families can be quite high. For example, suppose that two middle-class professionals have a child. What might the IQ of the parents be? From Wolfram (2023), (Not just) Intelligence stratifies the occupational hierarchy: Ranking 360 professions by IQ and non-cognitive traits:
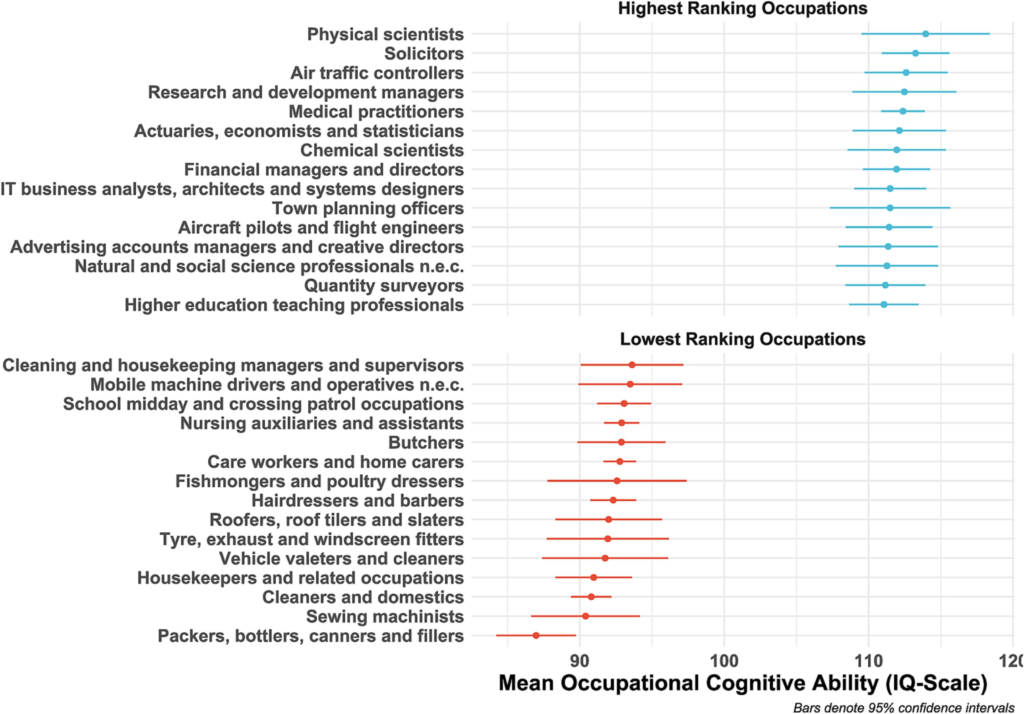
Let’s say that both parents are above-average ‘physical scientists’ with IQs of 120 or so. (This category may include lab technicians and so on, but it also includes PhDs, researchers, etc.). Their children will have IQ distributed with a mean of 120 points and a standard deviation of 12 points. Assuming for simplicity that their children have normally distributed IQ (which is maybe not quite the case, but should be close enough for illustration), a full 5% of their children will have IQs below the population average of 100, and nearly a full quarter (25%) of their children will have IQs below 110. In both cases, it is relatively unlikely that these children would be able to follow in their parents’ footsteps as physical scientists.
Regression to the mean
Several people have commented on this post noting that my model does not yield regression to the mean. This is true, but I feel that the omission is relatively minor.
Let us review why regression to the mean exists. Suppose that you have two very smart parents, both at +4 SD intelligence, and assume that intelligence is equally determined by genes and environment, so that
![\[I = G + E\]](/wp-content/ql-cache/quicklatex.com-37ecca7bd844a3dba70e82f2e5cb2ffa_l3.png "Rendered by QuickLaTeX.com")
where the variables represent  -scores.
If both  and
and  are normally distributed, then
  smart parents will be more likely to be, say,
  rather than
  and
and  (the probability mass of a Gaussian tails off exponentially). Then supposing the parents are indeed , and assuming that the children have completely independent environmental contribution as compared to their parents, then indeed the child IQ distribution will have a peak at
  , the genetic mean of the parents, rather than at , the full phenotypic mean of the parents.
In the modern world, which is fairly egalitarian (almost everyone has enough to eat), and where high IQ parents are probably richer and capable of supplying their children with an advantageous environment, I do not believe such independence assumptions hold, weakening the overall effect of regression to the mean.
Furthermore, note that this is an attempt to reproduce the child IQ distribution from the “first principles” of the genetic architecture of intelligence, assuming perfect knowledge of the parents’ genetic IQs. In that sense, it is not really accurate to say that the model fails to capture regression to the mean; it is more that it is focused on a subproblem simple enough that regression to the mean does not appear. One can of course argue that for real-world interpretability of the results, we need to take regression to the mean into account properly, but that would require a more complex model and a deeper discussion.
External references
I recommend these for further reading:
- Regression to the mean
- IQ regression from Terman data
- Assortative mating, regression and all that: offspring IQ vs parental midpoint
May 9th, 2023 at 12:57 pm
As a double-check, you can back out an estimate of the standard deviation from any heritability model, which should be fairly close to what the authors would have observed in their data.
For example, in the simple 80% A, 0% C, 20% E model, you get that the conditional standard deviation of the child’s IQ, given the IQs of the parents, is 15√(1-2*0.4²) = 12.4, which agrees nicely with Hsu’s model here.